The last post I wrote was about what students will say leads to their growth as writers. In that post, I mentioned the data system we use to track their progress, and several people asked me about it. Therefore, I am trying to explain some of its major and duplicable features. We actually developed it during the summer months three years ago, and then we launched it that fall. Perhaps some of you will be inspired to begin a similar tracking system.
As district-wide educator, one of the issues that bothered me involved those students who made growth over the course of the year, but always hovered in the “just barely making it” range. We used to send their final pieces of the year up to their next year’s teacher, but sometimes those pieces were a misrepresentation of them as writers. Summer would happen to these students, and they’d return to school with diminished writing skills, or the final piece would be a genre that perhaps they were weaker or stronger in–perhaps they wrote essays better than narratives or opinion articles better than informational pieces. Yet, their final piece only reflected the one final genre of the previous year. We wanted to develop a system that encompassed more time and revealed patterns and trends.
For many years, we have used a six trait analytic rubric to score student writing. Our traits are as follows:
- Focus
- Organization
- Elaboration
- Fluency
- Voice, and
- Conventions
We have four possible scores for each trait:
- Exceeds
- Meets
- Approaches, and
- Below
We made the decision that each score would correspond to a numerical value. Exceeds would earn 4 points and on down to 1 point for below. Therefore, the highest a student could receive on a writing piece would be a 24. I know that different districts use five traits, and some districts weigh traits differently. The system could still work. It could even work if you follow the way national assessments score writing, assigning points for structure, development, and conventions. The idea is that over the course of the year, students accumulate points that determine bands of performance based on cumulative total of several writing pieces. If you look at the top row of the chart below, that row represents a single student who generally performs on grade level for all writing pieces. The bottom student tends to exceed our standards, a trend consistent across the previous spring piece and throughout the year.
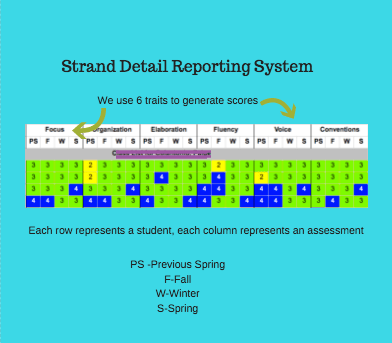
This data offers me many ways to look at students, teachers, grade levels–you name it–I can drill down to all different levels. The numbers from the chart above add up to totals between 6 and 24. We have determined ranges for exceeding, meeting, approaching, and below, as represented by the colors.

One change we made over the years to our system involves how students can meet standard. Initially, they had to score a 50 or above. We realized that if they performed badly on one assessment, they had no chance, so we decided that two scores of 17 could also meet for the year. These students are represented with a lighter green.

In addition to seeing how students do on an individual basis, I can also see how cohorts perform over time, and I can recognize teachers, like the one below, who have strong growth across their whole class of writers.

While these charts lean on the concept of using the six traits that we use, the system could be set up regardless of how you score student writing. As you can see from the charts, we end up with longitudinal data on individual students as well as classroom cohorts.
This data system has been phenomenally helpful in setting up coaching cycles and targeting students. The students who trend in the lower bands or who are continually cuspy become easy targets for coaches working together with teachers. Teachers can also spot classroom trends within specific traits so they can pinpoint their instruction.
Even though I have tried to explain the major components of our system, it’s admittedly complex, and we have tweaked it over the three years it’s been in place–I am sure that I have confused some of you readers, so please ask questions. Please reach out. And please think about the implementation of such a data tracking system. It has been an important source of student growth in writing.
Discover more from TWO WRITING TEACHERS
Subscribe to get the latest posts sent to your email.


I had both of those same questions!
LikeLike
Thank you for this detailed explanation!!! One thing I’m wondering is how you got to a common understanding of what constitutes a 4, 3, 2, 1 for each of the traits, across grade levels. Where would you suggest a school start to build that common understanding?
LikeLike
Hi Kathleen, We have annotated anchor sets, we have had PD, we have done blind scoring, and we do a fair amount of collaborative scoring. When teachers have questions about it, they often ask me–Google Drive makes it easier to share pieces, for sure. It’s definitely a process, but these practices have definitely helped develop consistency in our scoring.
LikeLike
Do you have the document conditionally formatted to color code? If so how do you get it to do the bright green since it breaks the rule or do you go back and do that manually?
LikeLike
Honestly, I’m not sure how our administrator does that–it was done on the programming end.
LikeLike